Nigeria's State Revenues Rose 93%. Can Governments Show What the Money Delivered?
Published October 15, 2026
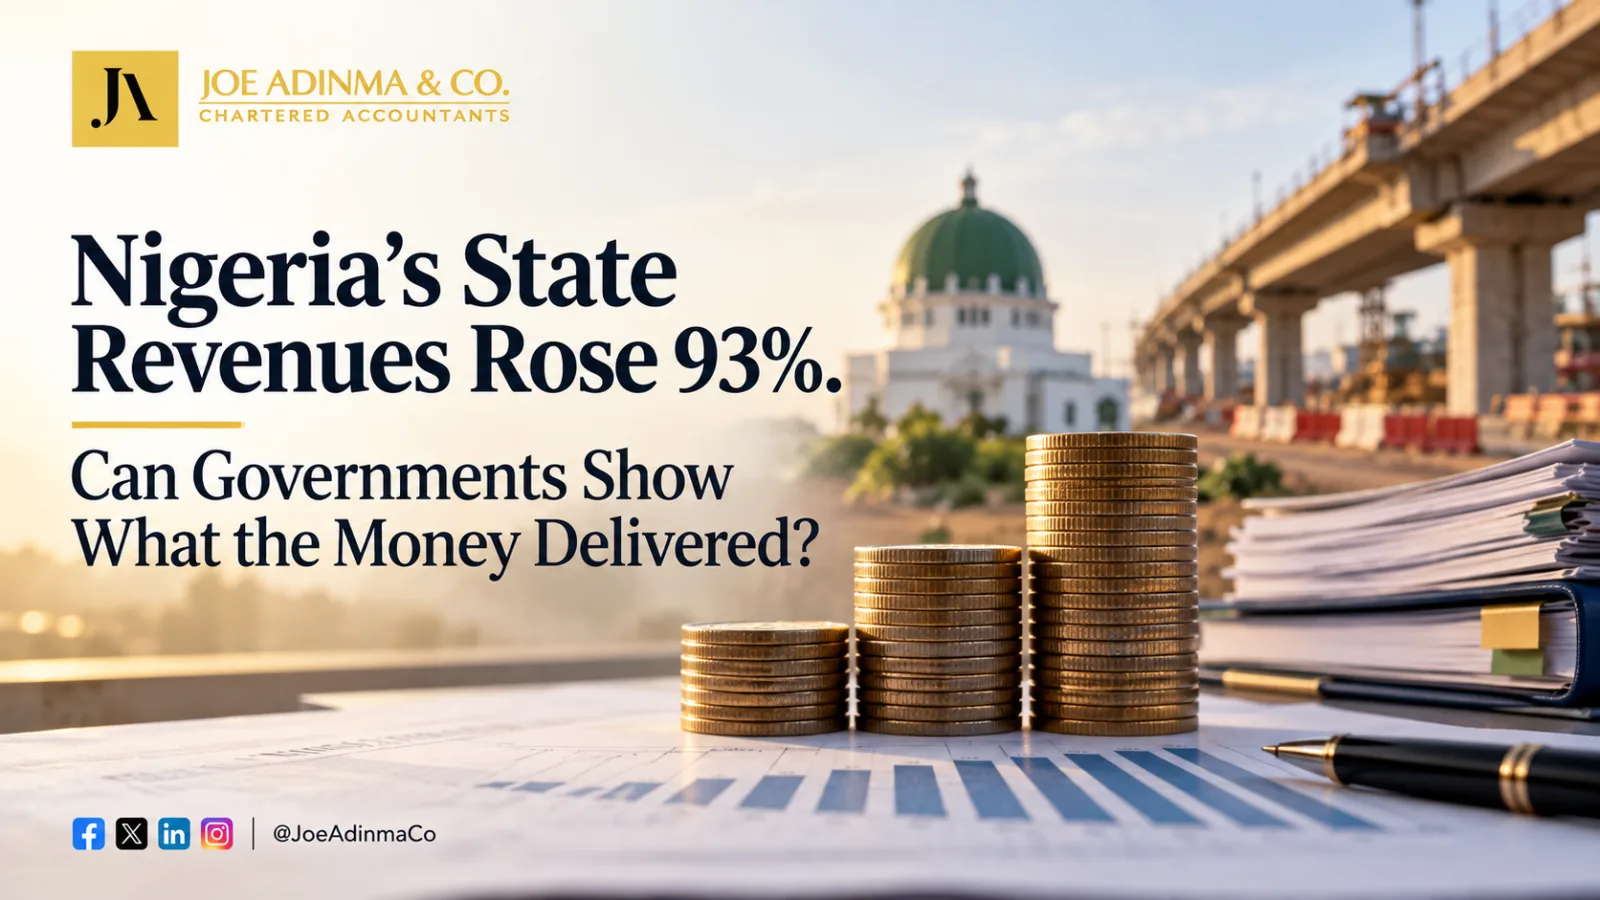
The World Bank's October 2026 findings show state finances sharply improved. A renewed gap between capital budgets and actual spending shows why money spent and value delivered are not the same thing.
By Joe Adinma, FCA, FCTI — Managing Partner, Joe Adinma & Co. (Chartered Accountants)
Last updated: 10 October 2026
On 12 July 2023, the Rivers State Government signed a ₦195.3 billion contract with Julius Berger for the Port Harcourt Ring Road: about 50 kilometres of dual carriageway, flyovers and a creek bridge, due in 36 months, with 77% of the sum — over ₦150 billion — to be paid at once. More than three years later, anyone who drives the corridor can see that the work is not finished. In October 2025, the Governor told reporters on site that "for lack of funds, the contractor withdrew from the site." The machines have since returned, but the public record still cannot say what has been paid in total, what has been built and what remains.
That question is not a Rivers problem alone. On 8 October 2026, the World Bank published its latest Nigeria Development Update, Beyond the Federal Purse: How Higher Revenues Reshaped State Priorities. It found that between 2023 and 2025, the combined revenue of Nigeria's state governments rose by about 93% in real terms, at constant 2019 prices, while their spending rose by about 92%.
For a federation long short of money, that is a genuine reform achievement. Yet the same report shows that after two years of markedly better execution, the gap between budgeted and actual state capital spending widened to 37% in 2025. More money was available; turning it into finished roads, classrooms and clinics remained uneven.
That is not evidence that 37% of anything disappeared. It is evidence that plans and delivery drifted apart. And it points to the test this reform will finally face: not what governments collect, but what they can show for it.
A bigger purse, but not an equal one
The 93% is an aggregate, adjusted for inflation. It does not mean every state gained 93%, and it does not mean the new money came mainly from states' own taxes. Gross federation revenue rose 69% in real terms between 2023 and 2025, net distributable revenue 60%, and state internally generated revenue (IGR) 62%. Real IGR grew in 31 of the 35 states the Bank compared.
The windfall was also uneven. Because much of the gain came from oil-related revenues and arrears repayments, the Bank says oil-producing states benefited disproportionately, widening the gaps between states. Measured as growth rather than size, the picture flips: Abia's real federation revenue rose 200%, Cross River's 190% and Imo's 184%, while Bayelsa's rose 27% from a much larger base.
Some of those inflows will not come back. A refund or the settlement of an old federal obligation is a one-off; stronger tax administration may recur. A windfall is like the rainy-season river: it fills fast, and it makes no promise to stay. The Bank's advice is to separate structural revenue gains from temporary windfalls and to set annual spending ceilings accordingly.
That advice matters because most states spent faster than their money grew. In 26 of the 34 states with data, real spending growth outpaced revenue growth. Median spending growth was about 134%, against median revenue growth of 79%. The near-identical aggregates of 93% and 92% hide that pattern.
Where the new money went
Capital spending rose 151% in real terms between 2023 and 2025, lifting its share of total state spending from 47.5% to 61.0%. Transport led the shift. State transport spending rose from about ₦0.1 trillion in 2021 to about ₦2.5 trillion in 2025, in 2019 prices, and took 26.5% of all state spending that year.
Social spending also rose, but more slowly. Education spending more than doubled in real terms between 2021 and 2025, yet its share of state spending fell from 14.9% to 12.1%. Health spending also rose sharply while its share slipped slightly; social protection grew in both amount and share. Figure 1 sets out the numbers.
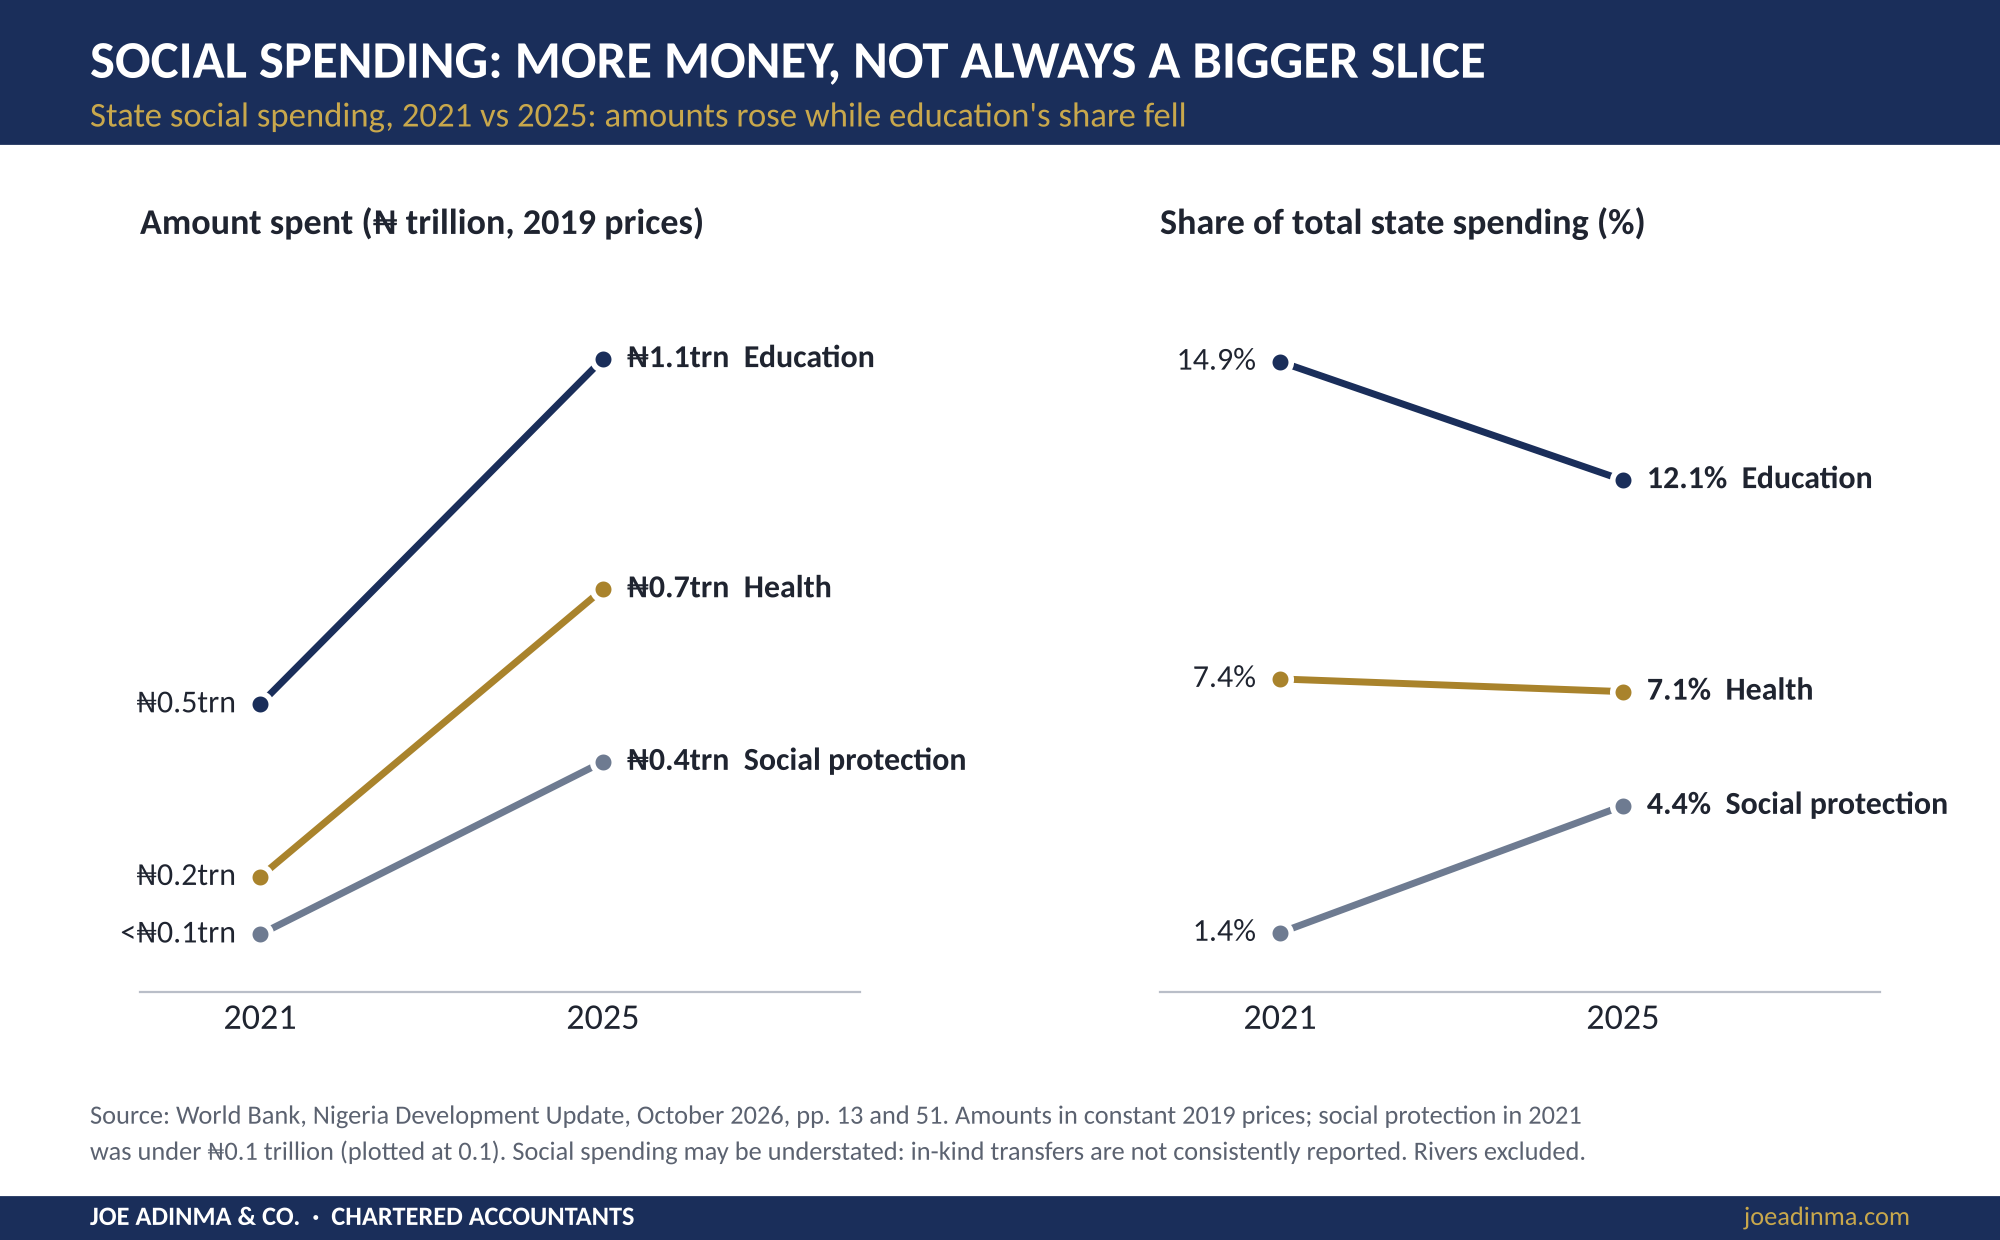
Figure 1: State social spending, 2021 vs 2025 — amounts and shares
The correct reading is not that states cut education or health. It is that infrastructure grew faster. In 29 of the 33 states the Bank could compare, the spending mix tilted towards economic infrastructure between 2022 and 2025, including 12 of the 13 states with below-average Human Capital Index scores. The Bank cautions that social spending may be understated, because in-kind transfers are not consistently captured in standard reporting.
A road and a clinic are not rivals; each makes the other more useful. But a finished road leading to a clinic without staff or equipment has only shortened the journey to an unanswered need. The real question is whether the mix is balanced, sustainable and effective.
The capital-budget warning
The World Bank tracks the gap between budgeted and actual capital spending across states. The gap was 43% in 2021 and 55% in 2022, narrowed to 15% and 12% in 2023 and 2024, then widened to 37% in 2025 (Figure 2). That is a relapse after two strong years, not an all-time low.
The Bank's own explanation is instructive. Approved budgets often exceed realistic financing and implementation capacity. And large or unexpected revenue inflows "can also complicate implementation by prompting supplementary allocations and significant in-year reallocations." A windfall, in other words, can make a budget less credible, not more — which may help explain the 2025 relapse, though the aggregate figures alone cannot prove it.
The right response is investigation, not accusation. A budget is an approved plan, not proof that the money was received or paid out. Spending can fall short because of unrealistic forecasts, delayed procurement, weak project preparation, cash constraints or a sensible decision to stop a project. The Bank points to weaknesses in budget credibility, commitment controls, procurement, public investment management, financial systems and audit follow-up.
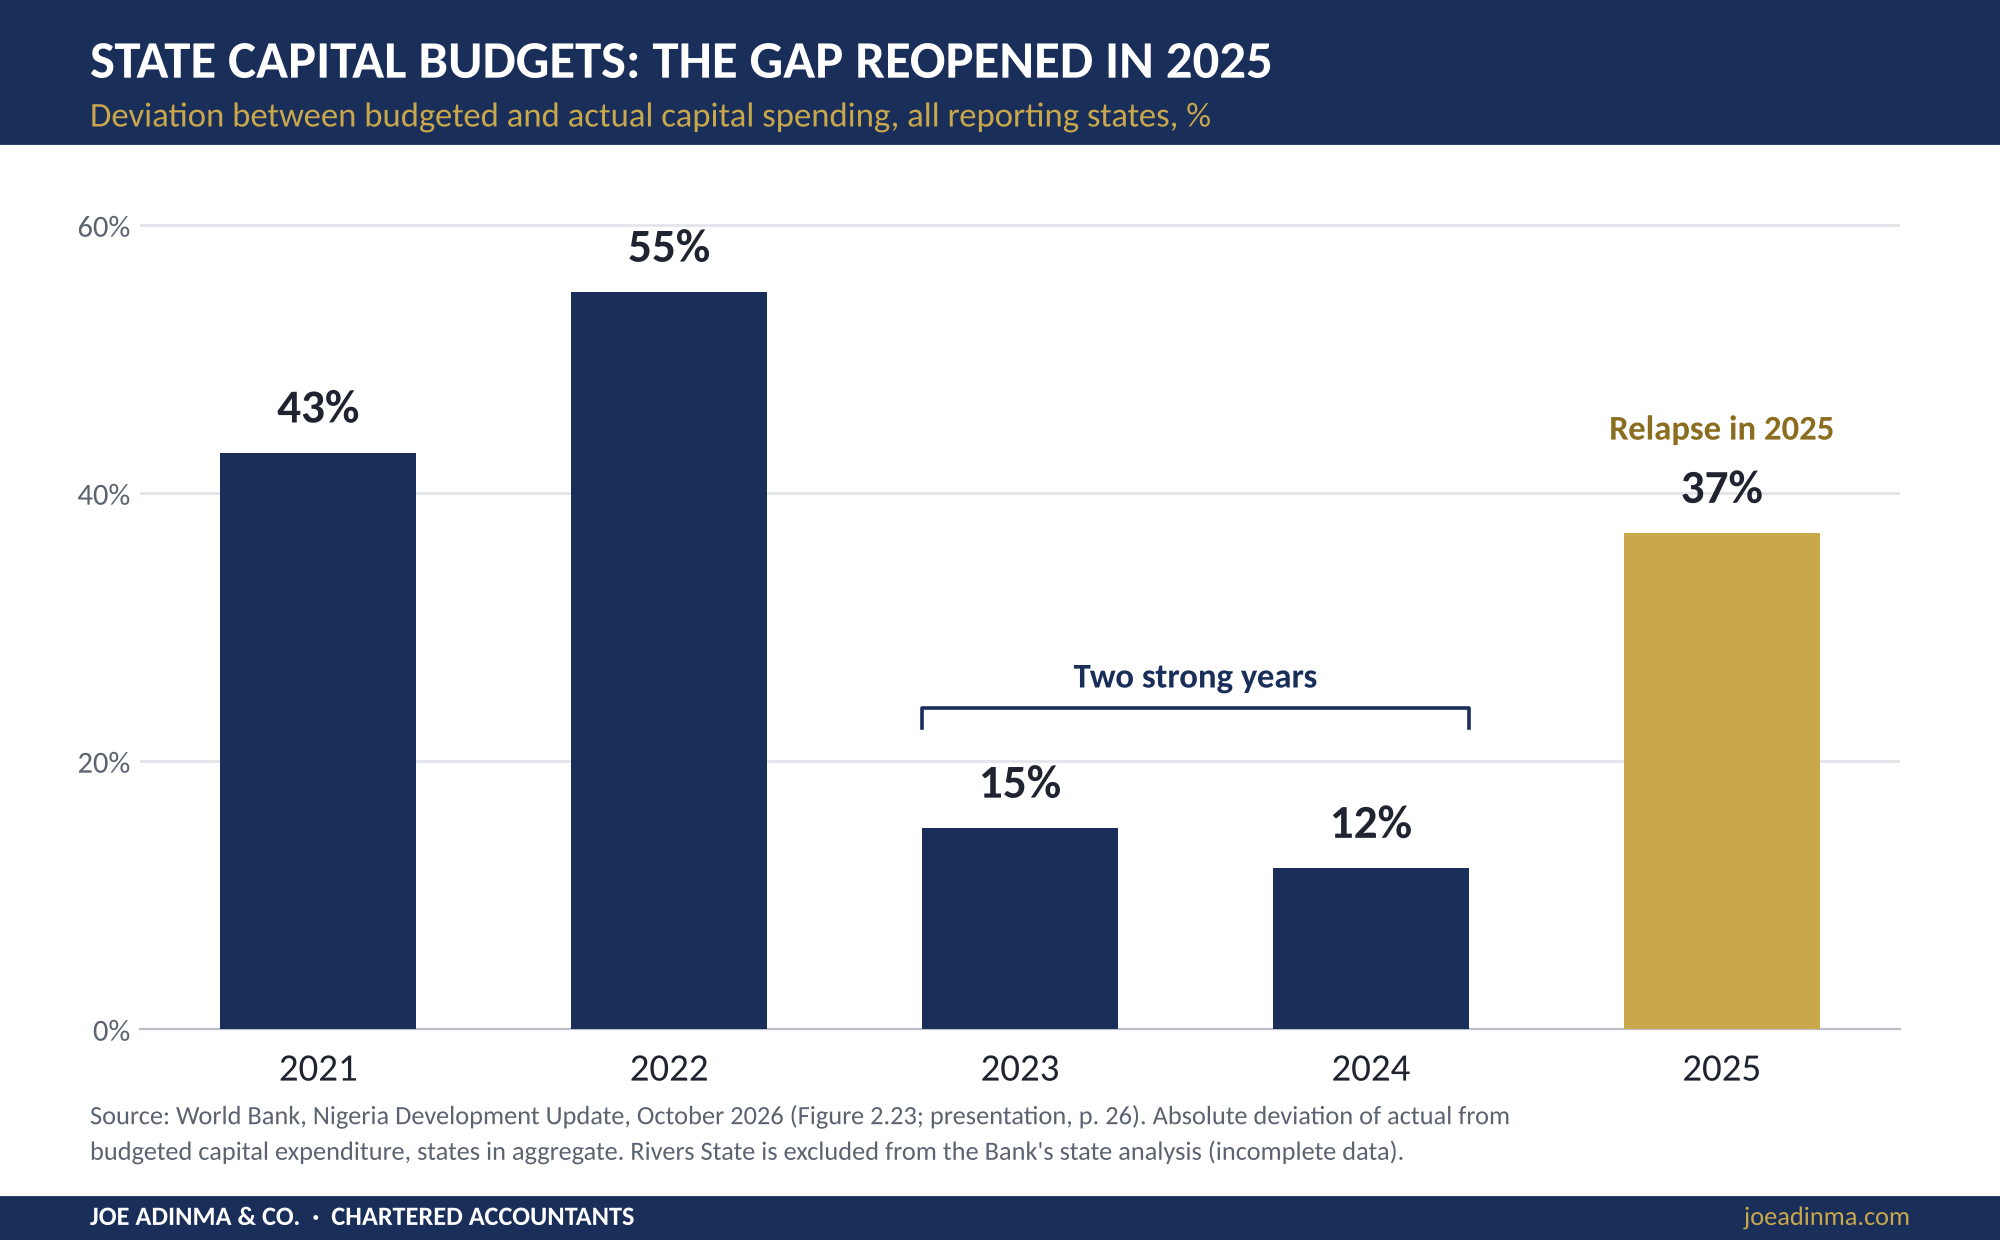
Figure 2: The gap between state capital budgets and actual capital spending, 2021–2025
An independent review by Agora Policy points the same way. Across the 35 states it reviewed for 2025, spending totalled ₦19.21 trillion, of which ₦11.87 trillion was capital. Capital budgets were implemented at 62.9%, against 79% for recurrent spending. Five states implemented more than 80% of their capital budgets; eleven implemented less than half.
Those figures measure execution, not results. A high implementation rate can sit alongside poor procurement or idle assets; a low one may reflect a prudent cancellation. As Agora itself concludes, "beyond the size of spending, the quality of spending is equally important." A project can look complete in the appropriation and still be missing from everyday life.
The missing-data problem is an accountability problem
Rivers State is absent from the World Bank's state-level analysis "due to incomplete publicly available data." The Bank notes that Rivers is one of the largest oil-producing states. Agora Policy also excluded Rivers from its 2025 review, reporting that the state published no budget implementation report for the year, possibly because of the six-month state of emergency.
So the 93% headline describes 35 states, and the state that hosts the Ring Road cannot be measured against it. That matters for anyone trying to judge a Rivers project against national trends. Delta and Yobe were also left out of the Bank's comparison of infrastructure and social spending for want of data. These are gaps in specific studies; the question they raise is practical.
Can citizens, legislators, auditors and researchers readily obtain comparable, timely and reliable figures on what their state spends and delivers? Where they cannot, public debate runs on announcements and isolated numbers. Complete 2025 budget implementation reports from Rivers would let the state be measured on the same terms as its neighbours. What is not published cannot be compared.
From publishing accounts to proving results
State fiscal reporting has improved, and that deserves credit. Nearly all states now publish budgets, quarterly budget implementation reports and audited financial statements, helped by the World Bank-supported SFTAS programme. The Bank's accountability chain follows public money through three stages: allocation, execution and audit.
But the Bank is clear that better information is necessary, not sufficient. Its reform agenda proposes a pivot from publishing fiscal information to routinely using it to improve results. An audited spending figure gives assurance over the accounts; it does not show that a facility works or a road carries traffic.
Joe Adinma & Co. therefore proposes a Public Revenue-to-Results Test, an extension of the Bank's chain rather than a substitute for it. It connects the financial trail to evidence of delivery and outcomes, with independent oversight running across every stage.
Stage | Question to answer | Evidence to examine |
Revenue | What resources were actually available, and which receipts will recur? | FAAC, IGR, financing and cash records |
Allocation | What spending was approved, and what results were promised? | Budgets, project appraisals and targets |
Execution | What was committed and paid, and under what controls? | Contracts, procurement files, ledgers and payment records |
Delivery | What assets or services were supplied and made operational? | Physical inspection, completion and operating records |
Outcomes | What public benefit was achieved, and for whom? | Service indicators, evaluations and beneficiary evidence |
Take a real project through the Test. Allocation: in July 2023, the Rivers State House of Assembly passed a ₦200 billion supplementary budget to fund the Port Harcourt Ring Road. Execution: the contract was signed at ₦195.3 billion, and 77% of it — over ₦150 billion — was paid at the outset. Delivery: the 36-month completion period has passed, and the work is not finished.
Even the cost is not settled. In May 2025, the state government disclosed that the contractor had requested a variation of ₦171.76 billion — 87.77% of the ₦195.70 billion contract sum the government then cited — which would take the contract to ₦367.45 billion. The government publicly resisted the request, and we could find no published figure for a final agreed contract value. The contractor has not, to our knowledge, set out its position publicly.
Five months later, the Governor said work had stalled because "for lack of funds, the contractor withdrew from the site." Each statement may be accurate on its own terms. The difficulty is that a citizen cannot reconcile them, because no single public record links the budget, the payments, the certified work and the claims still outstanding. That record is exactly what the Test asks for.
This is consistent with recognised public-sector assurance practice. ISSAI 300 frames performance auditing around economy, efficiency and effectiveness, while the IPSASB's Recommended Practice Guideline 3 gives non-mandatory guidance on reporting service performance. Financial audit, compliance audit, performance audit and programme evaluation have different scopes. A payment voucher proves that money left the treasury; it does not prove that a road arrived.
What should change in practice
First, budgets must become credible execution plans. Governments should separate lasting revenue gains from one-off receipts. Capital projects should enter the budget only after credible costing, appraisal, procurement planning and provision for maintenance, and material revisions should be explained.
Second, major projects need one traceable record. A single project identifier should link the approved allocation, contract, variations, payments, certified physical progress and final status. Variation requests, approved or not, should be disclosed with their status.
Third, outputs and outcomes should be reported separately. Kilometres of road completed or clinics equipped are outputs; shorter journeys and better health access are outcomes. Indicators should be set when a project is approved, not chosen afterwards to fit the result.
Fourth, audit findings need closure. Legislative hearings, management responses and corrective-action registers should record who must act, what was done and whether the matter was resolved. A finding that is repeated year after year weakens the audit itself.
Fifth, the accounting profession should help close the loop. Advance payments to contractors should be reported as advances, not as completed assets, until certified work supports the transfer. Capital work-in-progress should rest on certified valuations of physical progress, not on cash paid. And performance audits of major projects should become routine, not exceptional.
None of this requires every result to be measurable at once. Education, health and infrastructure can take years to show their full effect. That makes baseline data, interim milestones and consistent evaluation more important, not less.
Why taxpayers and businesses should care
Public spending outcomes sit inside every business's cost structure. Unreliable roads raise logistics costs; weak public services push employers and households to buy their own substitutes, from generators to boreholes. In Port Harcourt, where service companies move heavy equipment between the ports, Trans-Amadi and the East-West Road every day, a working road network is a cost line, not a slogan. Better use of the money states now have can strengthen competitiveness as well as living standards.
Tax obligations do not depend on satisfaction with services; the law applies either way. But trust in a tax system grows when people can trace a credible line from what government collects, to what it spends, to what the public receives. As tax administration tightens, that line matters more.
When the Port Harcourt Ring Road is finished, there will be a ribbon and speeches. The real test will come on an ordinary weekday: whether a truck crosses the city faster than it does today, and whether anyone can show, in one document, what the road cost and what it delivered. Nigeria's states have found the money. The next reform is learning to show their work.
How we sourced this
The state revenue, spending, composition and state-variation figures are from the World Bank's full October 2026 Nigeria Development Update, read in full for this article; the five-year capital-spending series is from the Bank's accompanying presentation. The Bank's press release gives the capital share's starting point as 46%; we use the report's own figure of 47.5% (2023). The capital-spending "gap" is the Bank's absolute deviation between budgeted and actual capital expenditure across states.
Agora Policy's figures come from its own review of 35 state budget implementation reports; its coverage and method differ from the Bank's, so the two sets of percentages should not be combined. Ring Road facts are drawn from contemporaneous reports of the contract signing, the supplementary budget, the state government's May 2025 statement and the Governor's October 2025 site visit; its condition is described as at 10 October 2026. The contract sum was announced as ₦195.3 billion at signing; the government's May 2025 statement gives ₦195.70 billion, the base for its 87.77% figure. An absence of published outcome data is not evidence that benefits did not occur.
This article is general information on public financial management, not professional advice on any specific matter. Figures are as published by the sources cited at the date shown above.
Related reading: "₦1.34 Trillion in Reported Audit Lapses: What Would an Auditor-General Find in Your Company?"
Sources
1. World Bank, Nigeria Development Update: Beyond the Federal Purse — How Higher Revenues Reshaped State Priorities, October 2026 (full report). https://documents1.worldbank.org/curated/en/099100726183025290/pdf/P513192-9694adf7-8564-447a-8518-63636f20d2c6.pdf
2. World Bank, "From Higher Revenues to Better Lives: Strengthening State Spending for Growth, Jobs, and Services," press release, 8 October 2026. https://www.worldbank.org/en/news/press-release/2026/10/08/higher-revenues-better-lives-strengthening-state-spending-for-growth-jobs-services
3. World Bank, Nigeria Development Update, October 2026 presentation. https://thedocs.worldbank.org/en/doc/b70f43f0db7039d2bff9f28c317a342f-0360012026/original/ndu-october-2026-presentation.pdf
4. Agora Policy, "Review of Performance of States' Budgets in 2025," 15 March 2026. https://agorapolicy.org/component/content/article/251-review-of-performance-of-states-budgets-in-2025.html
5. PM News, "Rivers: Fubara, Julius Berger sign ₦195.3bn Port Harcourt Ring Road contract," 13 July 2023. https://pmnewsnigeria.com/2023/07/13/rivers-fubara-julius-berger-sign-n195-3bn-port-harcourt-ring-road-contract/
6. SweetCrude Reports, "Rivers Assembly passes ₦200bn supplementary budget," 6 July 2023. https://sweetcrudereports.com/rivers-assembly-passes-n200bn-supplementary-budget
7. Vanguard, "Rivers govt condemns report claiming Julius Berger withdrew from project sites," 30 May 2025. https://www.vanguardngr.com/2025/05/rivers-govt-condemns-report-claiming-julius-berger-withdraws-from-project-sites/
8. BusinessDay, "Return of Fubara: Hope returns to ₦195bn PH Ring Road project," 13 October 2025. https://businessday.ng/?p=1033824
9. The Guardian Nigeria, "Rivers govt reaffirms commitment to completing P'Harcourt Ring Road project," 24 October 2025. https://guardian.ng/news/rivers-govt-reaffirms-commitment-to-completing-pharcourt-ring-road-project/
10. INTOSAI, ISSAI 300: Performance Audit Principles. https://www.issai.org/pronouncements/issai-300-performance-audit-principles/
11. IPSASB, Recommended Practice Guideline 3: Reporting Service Performance Information. https://www.ipsasb.org/publications/recommended-practice-guideline-3-1
12. Joe Adinma & Co., "₦1.34 Trillion in Reported Audit Lapses: What Would an Auditor-General Find in Your Company?" https://joeadinma.com/insights/n134-trillion-in-reported-audit-lapses-what-would-an-auditor-general-find-in-your-company